

2026-11-17 アリゾナ大学
<関連情報>
- https://news.arizona.edu/news/science-journals-went-online-their-figures-stayed-two-dimensional-until-now
- https://journals.asm.org/doi/10.1128/msphere.00460-26
肺炎球菌の血清型間における炭素源依存的な増殖の不均一性をインタラクティブなデータ可視化によって解明(Carbon source-dependent growth heterogeneity across Streptococcus pneumoniae serotypes revealed through interactive data visualization)
Fadi M. Sayegh, Chloe Scott, Klariza Ochoa, S. Sandra Bae, Michael D. L. Johnson
mSphere, Online First 2026-11-11
DOI:10.1128/msphere.00460-26

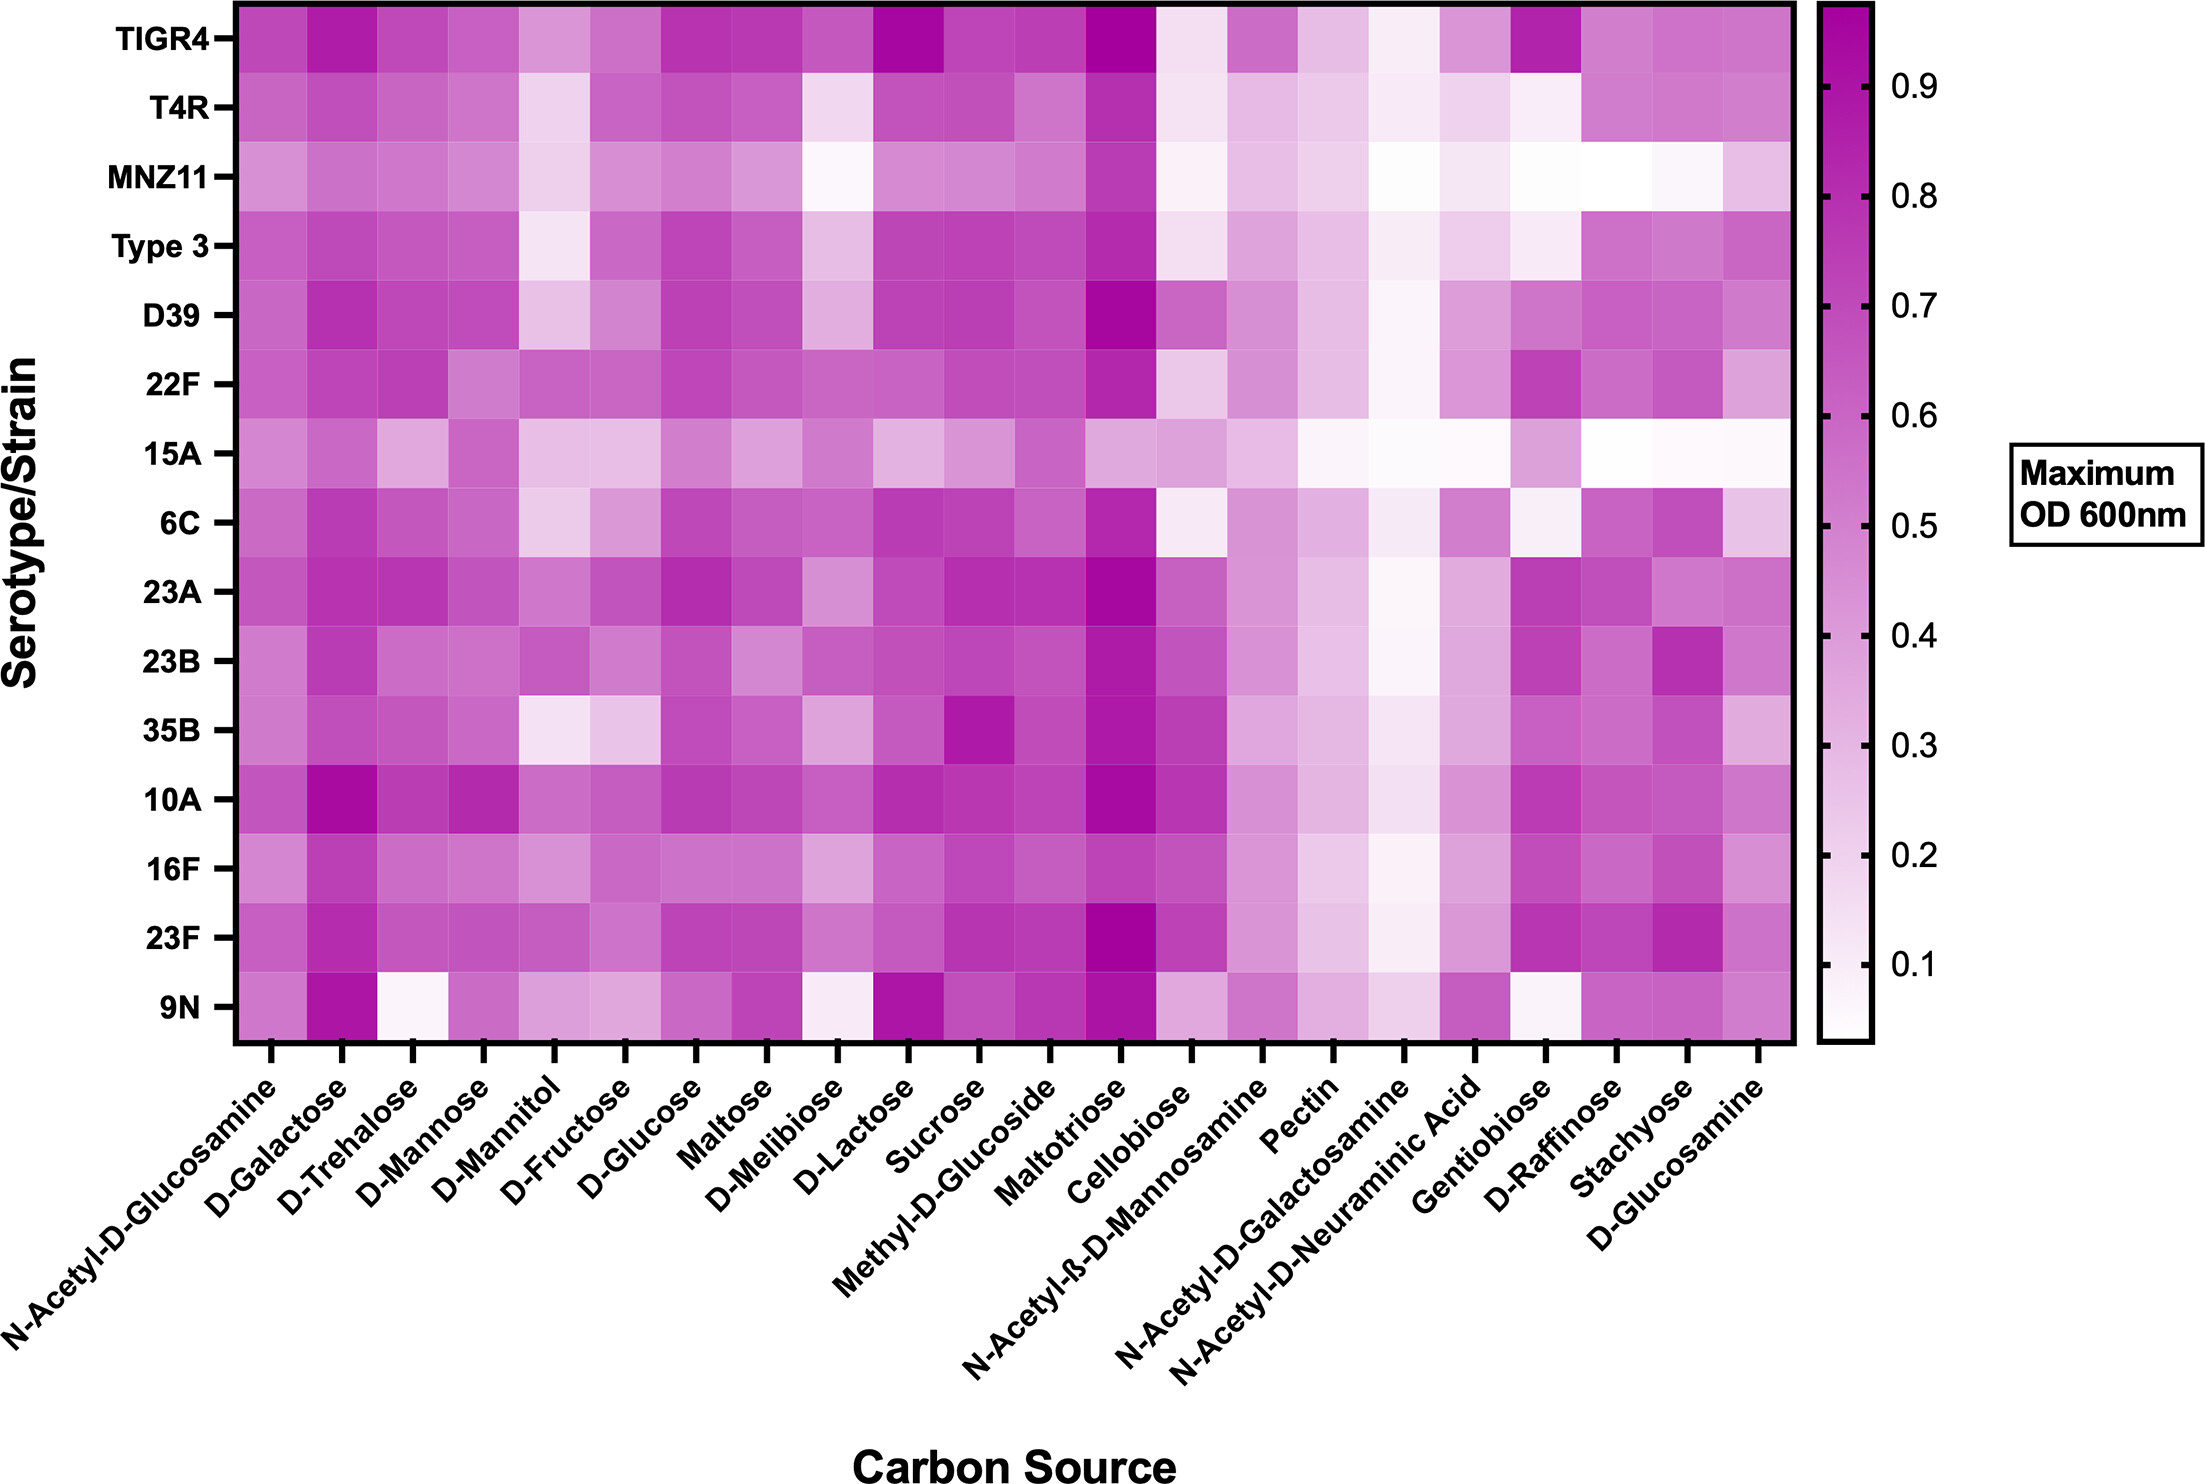
Fig 1 Heatmap of carbon source-dependent growth across pneumococcal strains and serotypes. Heatmap depicting the maximum optical density at 600 nm (OD600) achieved by Streptococcus pneumoniae strains and serotypes cultured in RPMI 1640mod supplemented with individual carbon sources using Biolog PM1/PM2 plates. Each tile represents the mean (three independent biological replicates) maximum OD600 reading attained during growth on the indicated carbon source, providing a comparative overview of peak growth across the different carbon sources utilized. Color intensity corresponds to growth magnitude, with darker colors indicating higher OD600 values, lighter colors indicating lower OD600 values, and white indicating no detectable growth.https://doi.org/10.1128/msphere.00460-26 Licensed under CC BY 4.0.
肺炎球菌(Streptococcus pneumoniae)は、ヒトの上気道への定着や感染の進行に伴い、宿主環境に応じて炭素源の利用を変化させる。本研究では、Biolog表現型マイクロアレイを用いて190種類の炭素源を調べ、莢膜を持つ複数の血清型と非莢膜株を含む15菌株の増殖特性を比較した。グルコース、ガラクトース、N-アセチルグルコサミンなどは多くの菌株で良好な増殖を支えた一方、炭素源の利用能力、最大増殖量、増殖開始時期、増殖後の菌体密度低下には菌株ごとの違いが認められた。特に、最大増殖量が類似していても増殖曲線の推移は異なり、単一時点の測定だけでは代謝特性を十分に評価できないことが示された。さらに、増殖曲線とヒートマップを連動させるインタラクティブ表示や、炭素源利用の共通性を比較するベン図を開発し、読者が測定データを直接探索できる仕組みを構築した。本研究は肺炎球菌の代謝適応に関する知見に加え、大規模な生物学的データを透明性と詳細さを保って共有するための新しい論文公開手法を提示している。
Streptococcus pneumoniae adapts its carbon source utilization to different host environments during upper respiratory tract colonization and infection. In this study, the researchers used Biolog phenotype microarray plates to examine 190 carbon sources and compared growth characteristics across 15 pneumococcal strains, including encapsulated serotypes and non-encapsulated strains. Glucose, galactose, and N-acetylglucosamine supported robust growth in many strains, whereas carbon source utilization, maximum growth, growth onset, and post-peak declines in bacterial density varied among strains. Notably, similar maximum growth levels could be associated with distinct growth trajectories, demonstrating that measurements at a single time point are insufficient to fully characterize metabolic phenotypes. The researchers also developed interactive visualizations that link heatmaps to complete growth curves and use Venn diagrams to compare shared and strain-specific carbon source utilization. These tools allow readers to explore the underlying experimental data directly. The study provides insights into pneumococcal metabolic adaptation and introduces an approach to scientific publishing that improves the transparency, accessibility, and interpretability of large biological data sets.

