2026-08-04 京都大学
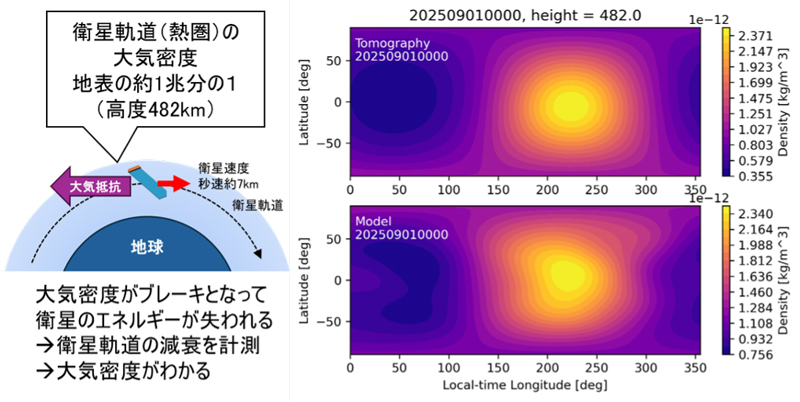
(左側)大気抵抗を用いて衛星高度(熱圏)の大気密度を計測する原理図。(右側)本研究で推定した高度482kmの大気密度の緯度経度分布(上:実測値)と、経験モデルから予想される大気密度分布(下:比較相手)。
<関連情報>
- https://www.kyoto-u.ac.jp/ja/research-news/2026-08-04-1
- https://link.springer.com/article/10.1186/s40623-026-02509-5
- https://link.springer.com/article/10.1186/s40623-026-02402-1
Starlink Ephemerisによる熱圏密度断層撮影:初期報告 Tomography of thermospheric density from Starlink Ephemeris: initial report
Mamoru Yamamoto
Earth,Planets and Space Published:30 July 2026
DOI:https://doi.org/10.1186/s40623-026-02509-5
Abstract
This report presents the first demonstration of successful tomographic analysis of thermospheric density using orbital data from a massive Starlink satellite constellation. Thermospheric density, the neutral atmospheric density at altitudes between 100 and 1000 km, is essential for advancing upper-atmosphere science and supporting space engineering operations. While traditional observation methods rely on Two-Line Element (TLE) data, this study presents a novel tomographic analysis using Starlink Ephemerides, i.e., detailed orbital information publicly released by SpaceX. Unlike TLEs, these ephemerides provide high-resolution position and velocity vectors, allowing for precise estimation of satellite energy loss due to atmospheric drag. We developed a method to quantify energy loss and a coefficient that relates it to thermospheric density. We calculated the energy dissipation for approximately 1200 satellites at an altitude of 482 km and an inclination of 53°, which served as the basis for a tomographic analysis. We employed a spherical harmonic expansion to model the longitude-by-latitude density distribution, but only diurnal variation was considered in this report. The density-height distribution was assumed to decrease exponentially with a single scale height of 60 km. The analysis was conducted for the period September 1–7, 2025, and captures features of thermospheric density that the NRLMSIS 2.1 model predicts. The results were validated against independent density measurements from the SWARM satellites. The tomographic estimates demonstrated high consistency with SWARM observations, e.g., density variations along satellite trajectories. Quantitative comparisons across 19 cases showed that the estimated density values ranged from 0.6 to 1.2 times the SWARM measurements, with an overall average ratio of 0.95. These findings suggest that this method has the potential to provide rapid, high-resolution thermospheric density data.
Starlink TLEによる熱圏密度:データ解析と予備的結果 Thermospheric density from Starlink TLE: data analysis and preliminary results
Mamoru Yamamoto & Takuya Sori
Earth,Planets and Space Published: 01 April 2026
DOI:https://doi.org/10.1186/s40623-026-02402-1
Abstract
This study examines the feasibility of utilizing Two-Line Element (TLE) data from Starlink satellites to estimate thermospheric density. TLE data for satellites in orbital decay were collected from September 19 to November 6, 2024. Using the method of Picone et al., J Geophys Res, (2005), thermospheric density was derived from the time derivative of the satellites’ mean motion and assessed not as an absolute value, but as a relative variation to the NRLMSIS 2.1 model. The density estimates followed well with the model values below 400 km, although occasional deviations of a factor of 2–3 were found at higher altitudes. Three notable density increases were observed on October 8, 11, and 18–20, 2024. The first two events are well associated with geomagnetic storms. The density perturbations appeared across the most altitude range and lasted approximately one day. The third event, however, showed a weak association with the geomagnetic disturbance, persisted for several days, and was limited to altitudes above 400 km. Our findings confirm that contemporary TLE data are a valuable resource for monitoring thermospheric density dynamics.