2025-05-08 中国科学院(CAS)
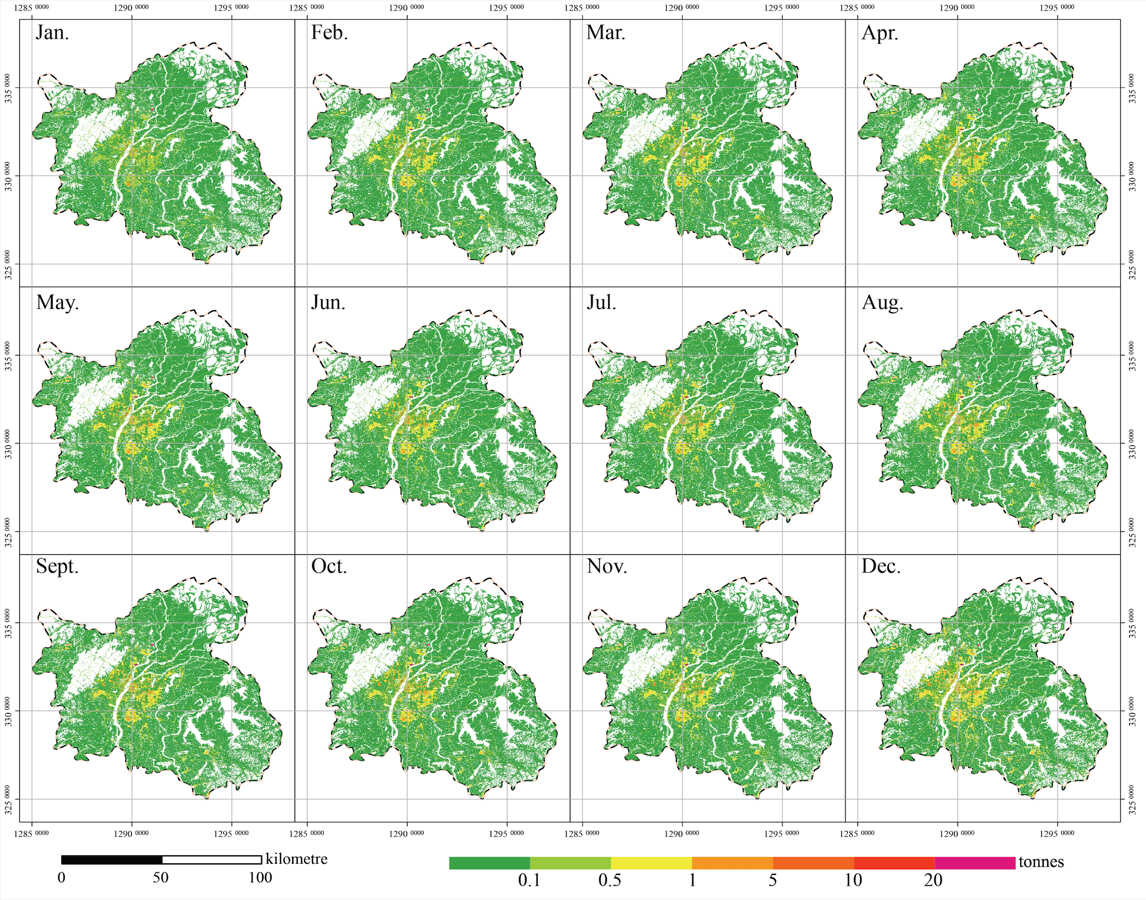
 Distribution of monthly CO2 emissions of Nanchang in 2020 with 30-meter resolution. (Image by AIR)
<関連情報>
- https://english.cas.cn/newsroom/research_news/infotech/202505/t20250508_1042816.shtml
- https://www.tandfonline.com/doi/full/10.1080/17538947.2025.2491819
都市の炭素動態の解明:南昌市の二酸化炭素排出に関するマルチソースデータ研究 Unravelling urban carbon dynamics: a multi-source data study on Nanchang city’s carbon dioxide emissions
Lingyun Yao,Li Wang,Ke Wang & Zheng Niu
International Journal of Digital Earth Published: 15 Apr 2025
DOI:https://doi.org/10.1080/17538947.2025.2491819
ABSTRACT
Urban CO2 emissions constitute a significant proportion of the total global emissions, and the analysis of urban CO2 emissions typically requires the availability of baseline data with high spatiotemporal resolution. However, it is challenging to achieve an optimal balance between the quality and quantity with existing mapping methods. The objective of this study is to develop a rapid mapping method for urban CO2 with high spatiotemporal resolution based on multi-source data. The case study of Nanchang in 2020 will be used. The results demonstrate that: (1) the emission structure of Nanchang is primarily characterised by the industrial and energy sectors, accounting for more than 70%. Within the industrial subsectors, metal smelting is responsible for the largest share of emissions, over 75%. (2) Areas with elevated levels of emissions are concentrated in urban cores and industrial towns on the periphery, forming three major clusters that are predominantly characterised by industrial land use. (3) The annual emission results exhibit an acceptable error of 13.9% in comparison to the CEADs. Furthermore, the distribution results demonstrate a higher resolution and a broader range of values in comparison to ODIAC, thereby avoiding the averaging of values.


