南極の海氷が歴史的な低水準に、北極の海氷は減少を続ける(Antarctic Sea Ice Near Historic Lows; Arctic Ice Continues Decline)

ad

2024-03-25 NASA

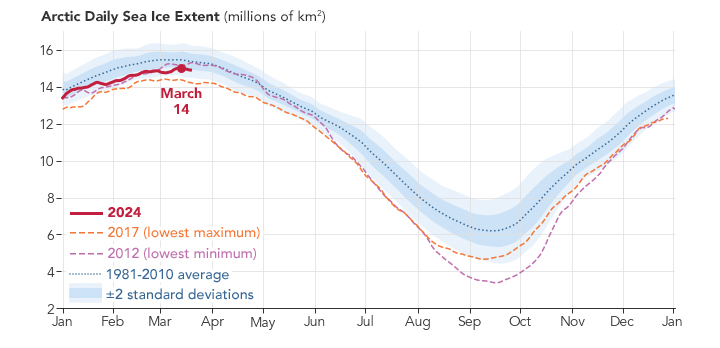
An illustrated graph depicting the annual fluctuation of ice in the Arctic. The x-axis shows January through December while the y-axis starts at 2 and goes up to 16 by 2's, depicting the millions of square kilometers. Several lines go across the graph in blue, red, orange, and pink colors. The lines are dotted and dashedd or show a larger area. The lines move closely together in a wave-like motion starting from the top left of the graph and moving to the right. The lines peak in March and reach a minimum in September.
The Arctic Ocean sea ice reached its annual maximum on March 14, continuing the long-term decline in ice at the poles.
Chart by Lauren Dauphin/NASA Earth Observatory, using data from the National Snow and Ice Data Center.

2024年、南極周辺の海氷は3年連続で史上最低水準に減少し、これは地球温暖化の影響である可能性が高い。一方、北極海の氷は46年間続く減少傾向が続いており、今年の最大氷範囲は14番目に低い。これにより、地球は太陽の熱をより受けやすくなり、氷の厚さの減少は新しい氷の形成が毎年必要とされることを示している。

<関連情報>

ad

1702地球物理及び地球化学
ad
ad
Follow
ad
タイトルとURLをコピーしました