2025-05-29 京都大学
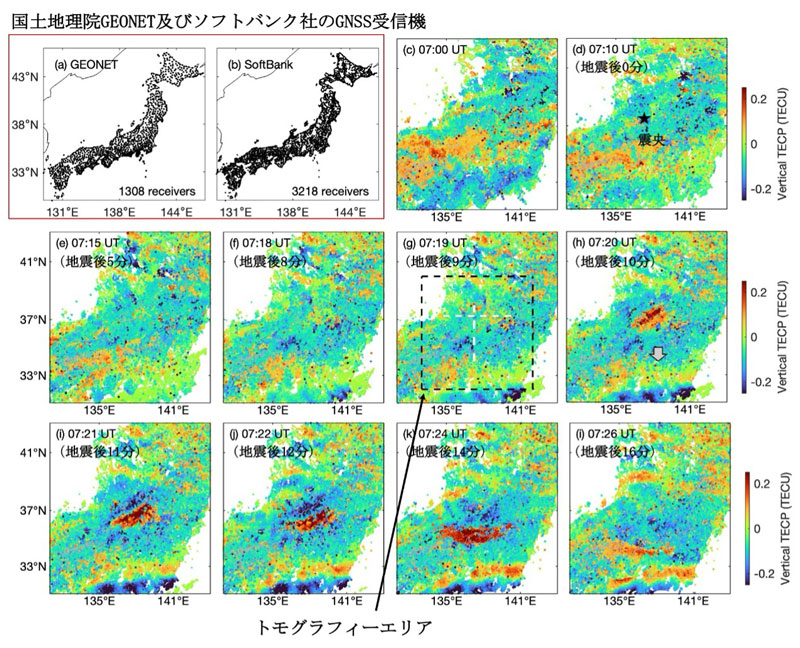
 (a) (b):GEONETとソフトバンク社が提供するGNSS受信機の分布。(c)~(l):令和6年能登半島地震の直後TEC の変動成分の2次元マップ図。縦軸と横軸はそれぞれ、地理緯度と経度を表す。黒の点線で囲まれた部分は、3次元トモグラフィーの解析領域を示している。五角星は震央を示している。
<関連情報>
- https://www.kyoto-u.ac.jp/ja/research-news/2025-05-29-2
- https://www.kyoto-u.ac.jp/sites/default/files/2025-05/web_2505_Sori-6e441882982c08b8bc276ba201b5d0c1.pdf
- https://earth-planets-space.springeropen.com/articles/10.1186/s40623-025-02211-y
超高密度GNSSネットワークによる2024年能登半島地震後の垂直電離層応答の解明 Unveiling the vertical ionospheric responses following the 2024 Noto Peninsula Earthquake with an ultra-dense GNSS network
Weizheng Fu,Yuichi Otsuka,Nicholas Ssessanga,Atsuki Shinbori,Takuya Sori,Michi Nishioka & Septi Perwitasari
Earth, Planets and Space Published:29 May 2025
DOI:https://doi.org/10.1186/s40623-025-02211-y
Abstract
This paper leverages total electron content (TEC) perturbations obtained from an ultra-dense Global Navigation Satellite System (GNSS) receiver network across the Japanese archipelago to reconstruct the three-dimensional (3-D) structures of ionospheric responses following the 2024 Noto Peninsula Earthquake (Mw7.5). Reconstructions successfully captured the concentric electron density perturbations extending radially from the epicenter in the horizontal and vertical cross section 9–10 min after the earthquake. At south of the epicenter, in the meridional-vertical cross sections, phases of the electron density perturbations have a tilted structure stretching from north-up to south-down, which gradually becomes more vertical over time. Model calculations indicate that these electron density perturbations are caused by seismic acoustic waves, with sound velocity increasing at higher altitudes. However, the difference between theoretical predictions and reconstruction results may suggest the non-linear propagation of acoustic waves in the ionosphere, and the presence of multiple acoustic wave sources along the fault.


