2024-10-29 ペンシルベニア州立大学(PennState)
<関連情報>
- https://www.psu.edu/news/research/story/microplastics-increasing-freshwater-directly-related-plastic-production
- https://www.sciencedirect.com/science/article/abs/pii/S0048969724067755?via%3Dihub
淡水堆積物中のマイクロプラスチック蓄積の10年ごとの変化: 影響因子の評価 Decadal changes in microplastic accumulation in freshwater sediments: Evaluating influencing factors
Jutamas Bussarakum, William D. Burgos, Samuel B. Cohen, Kimberly Van Meter, Jon N. Sweetman, Patrick J. Drohan, Raymond G. Najjar, Jill M. Arriola, Katharina Pankratz, Lisa A. Emili, Nathaniel R. Warner
Science of The Total Environment Available online: 1 October 2024
DOI:https://doi.org/10.1016/j.scitotenv.2024.176619
Graphical abstract

Highlights
- MP abundance and dominant morphology varied among 4 age-dated sediment cores.
- No correlation between MP abundance and urban area or population in watersheds
- Open water area within a watershed correlated with MP abundance.
- MP abundance in sediment increased with plastic production from 1950s–2010s.
Abstract
Microplastics are small plastic particles with sizes ranging between 1 μm and 5 mm. Microplastics can originate from macro plastics and degrade to a smaller size or be produced directly by manufacturers. Few studies have examined microplastic contamination in freshwater sediment cores to estimate changes in microplastic contamination over time. We present the results of a study that examined sediment cores from four watersheds, Kiskiminetas River, Blacklick Creek, Raystown Lake, and Darby Creek, in Pennsylvania, USA to reveal the history of microplastic accumulation and factors that contribute to microplastic distribution. The abundance and morphology of microplastics varied over time and between these four locations. The highest microplastic abundance was found in Raystown Lake, ranging from 704 to 5397 particles kg−1 with fiber as the dominant microplastic type, while Darby Creek (0–3000 particles kg−1), Kiskiminetas River (0–448 particles kg−1), and Blacklick Creek (0–156 particles kg−1) had lower microplastic concentration. Moreover, Darby Creek had the most diverse microplastic morphology and a trend of decreasing concentration with depth. Although the Darby Creek watershed has the most developed area and highest population density, it did not have the highest microplastic concentration. Averaged over the four cores, microplastic abundance increased as global plastics production increased from the 1950s–2010s. Our findings provide insights into the fate and transport of microplastic contamination in freshwater environments, which is vital to establishing sustainable mitigation strategies.
河川マイクロプラスチックのフィルターとしての河口: 大規模な沿岸平野河口におけるシミュレーション Estuaries as Filters for Riverine Microplastics: Simulations in a Large, Coastal-Plain Estuary
Alexander G. López,Raymond G. Najjar,Marjorie A. M. Friedrichs,Michael A. Hickner,Denice H. Wardrop
Frontiers in Marine Science Published:26 August 2021
DOI:https://doi.org/10.3389/fmars.2021.715924

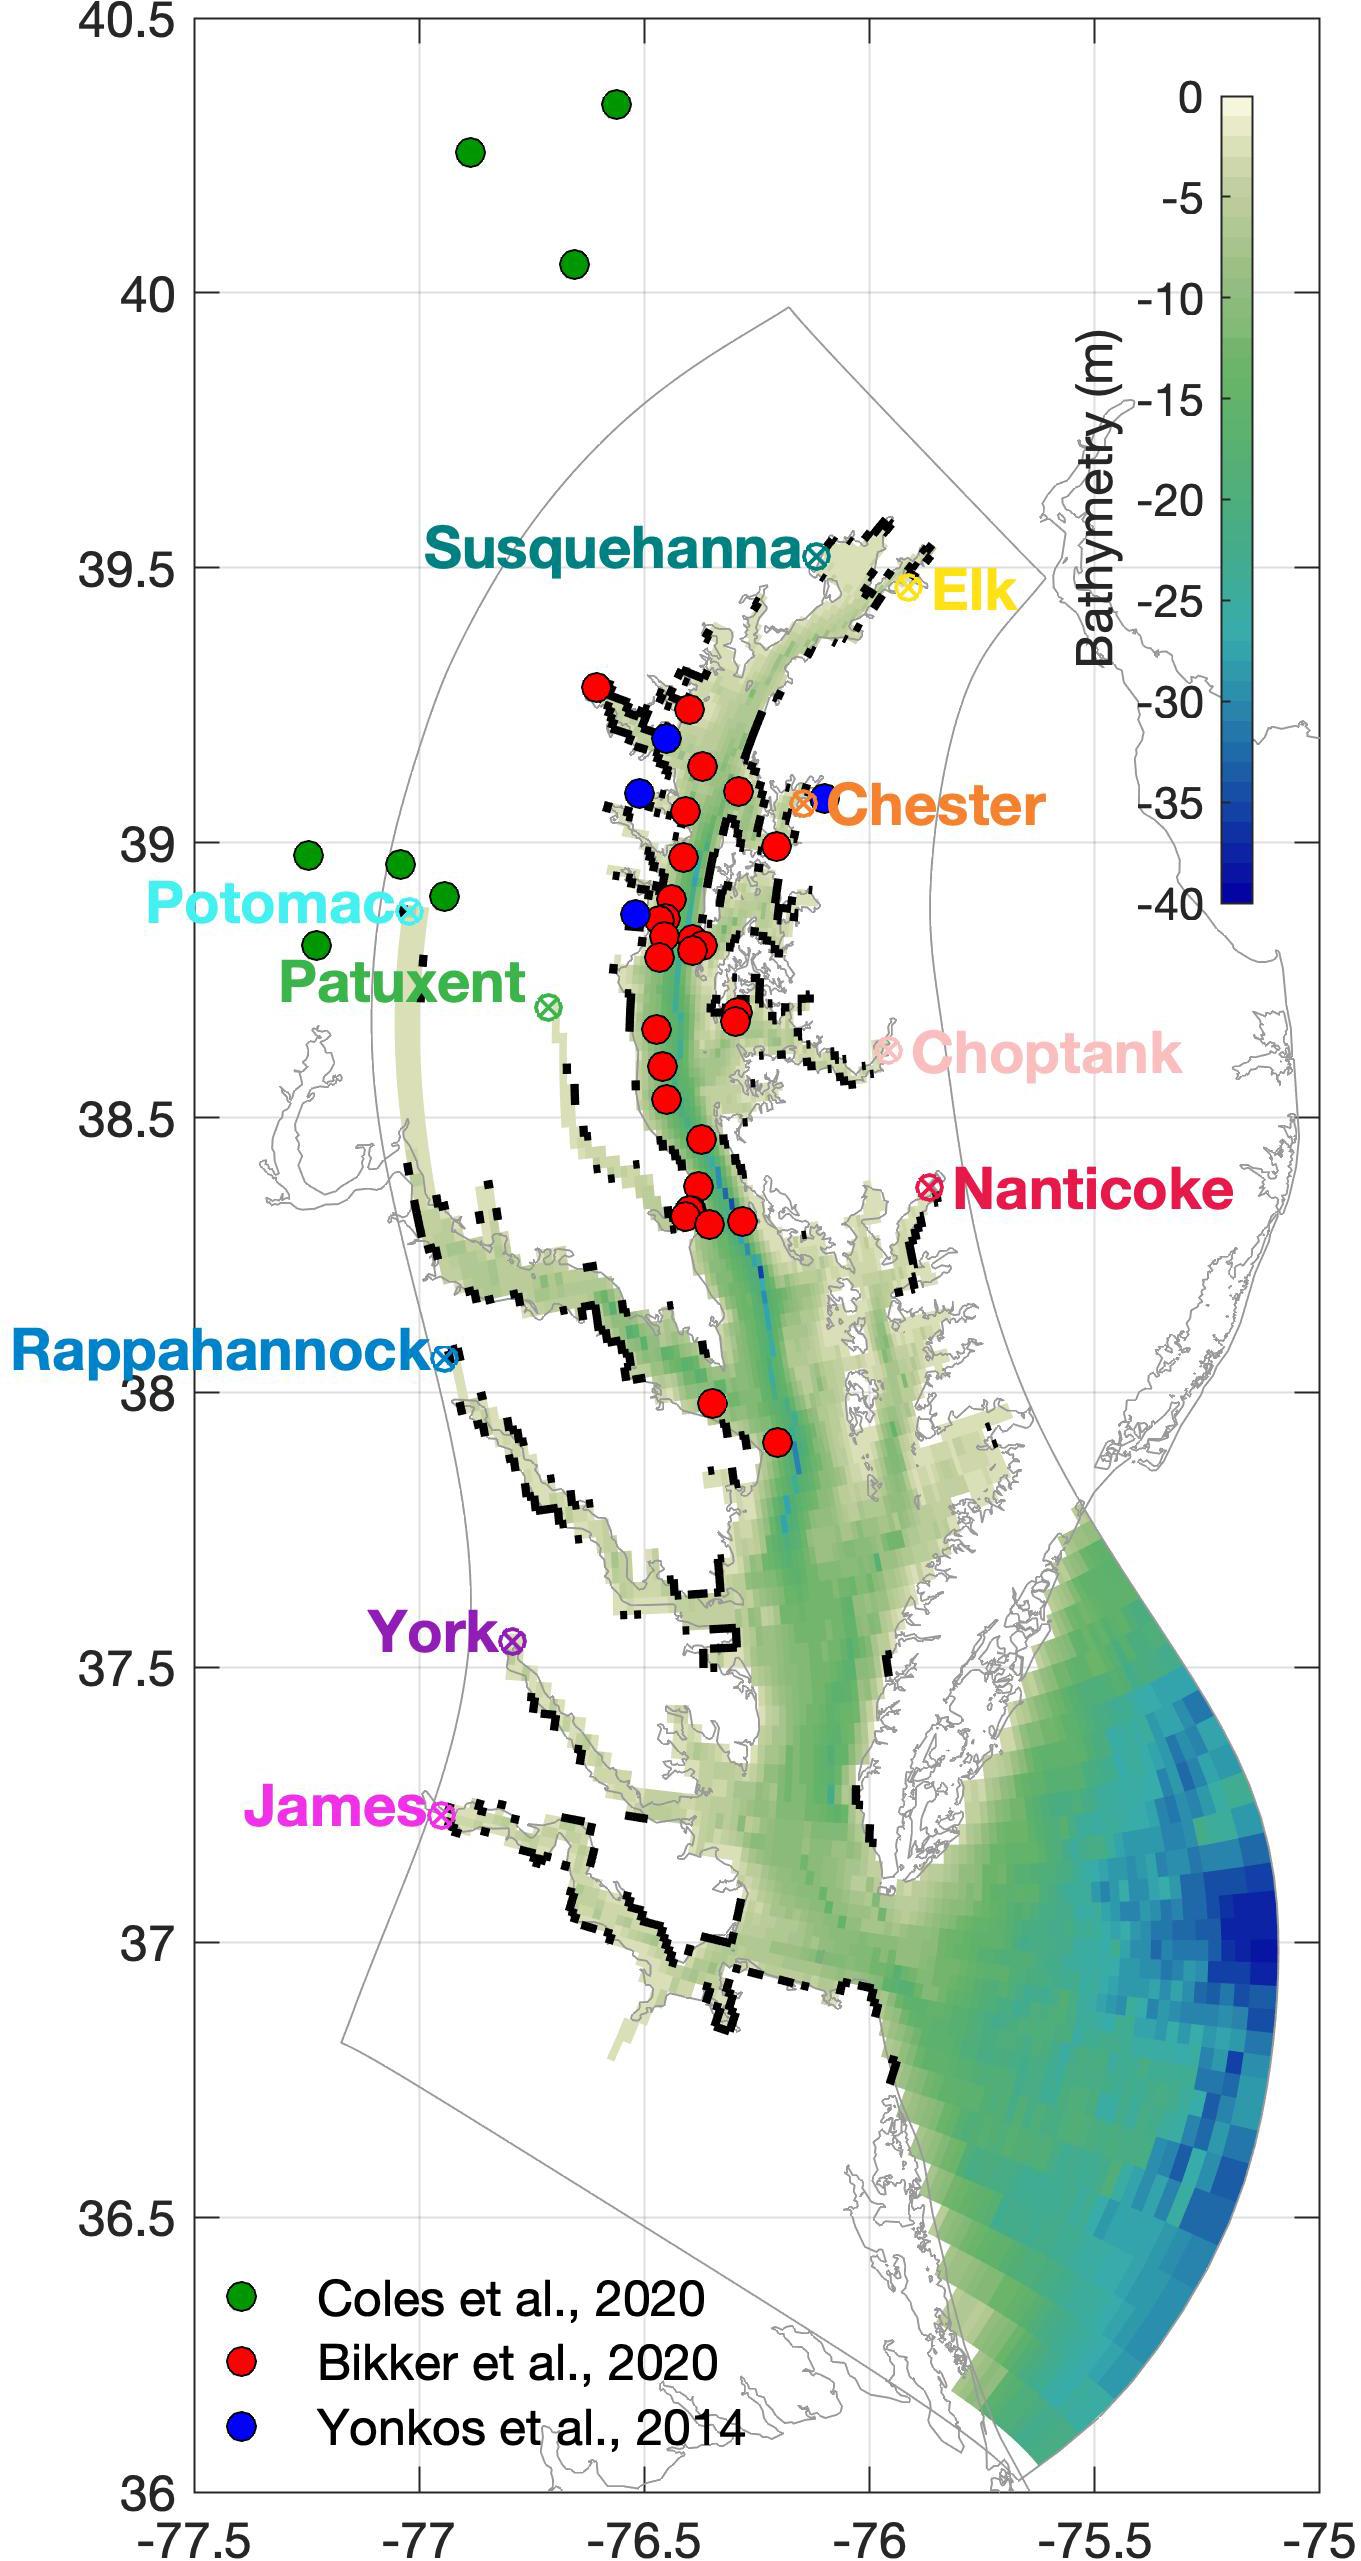
Public awareness of microplastics and their widespread presence throughout most bodies of water are increasingly documented. The accumulation of microplastics in the ocean, however, appears to be far less than their riverine inputs, suggesting that there is a “missing sink” of plastics in the ocean. Estuaries have long been recognized as filters for riverine material in marine biogeochemical budgets. Here we use a model of estuarine microplastic transport to test the hypothesis that the Chesapeake Bay, a large coastal-plain estuary in eastern North America, is a potentially large filter, or “sink,” of riverine microplastics. The 1-year composite simulation, which tracks an equal number of buoyant and sinking 5-mm diameter particles, shows that 94% of riverine microplastics are beached, with only 5% exported from the Bay, and 1% remaining in the water column. We evaluate the robustness of this finding by conducting additional simulations in a tributary of the Bay for different years, particle densities, particle sizes, turbulent dissipation rates, and shoreline characteristics. The resulting microplastic transport and fate were sensitive to interannual variability over a decadal (2010–2019) analysis, with greater export out of the Bay during high streamflow years. Particle size was found to be unimportant while particle density – specifically if a particle was buoyant or not – was found to significantly influence overall fate and mean duration in the water column. Positively buoyant microplastics are more mobile due to being in the seaward branch of the residual estuarine circulation while negatively buoyant microplastics are transported a lesser distance due to being in the landward branch, and therefore tend to deposit on coastlines close to their river sources, which may help guide sampling campaigns. Half of all riverine microplastics that beach do so within 7–13 days, while those that leave the bay do so within 26 days. Despite microplastic distributions being sensitive to some modeling choices (e.g., particle density and shoreline hardening), in all scenarios most of riverine plastics do not make it to the ocean, suggesting that estuaries may serve as a filter for riverine microplastics.


